| |
 |
|
|
|
|
|
Poster: 181
Visits: 93
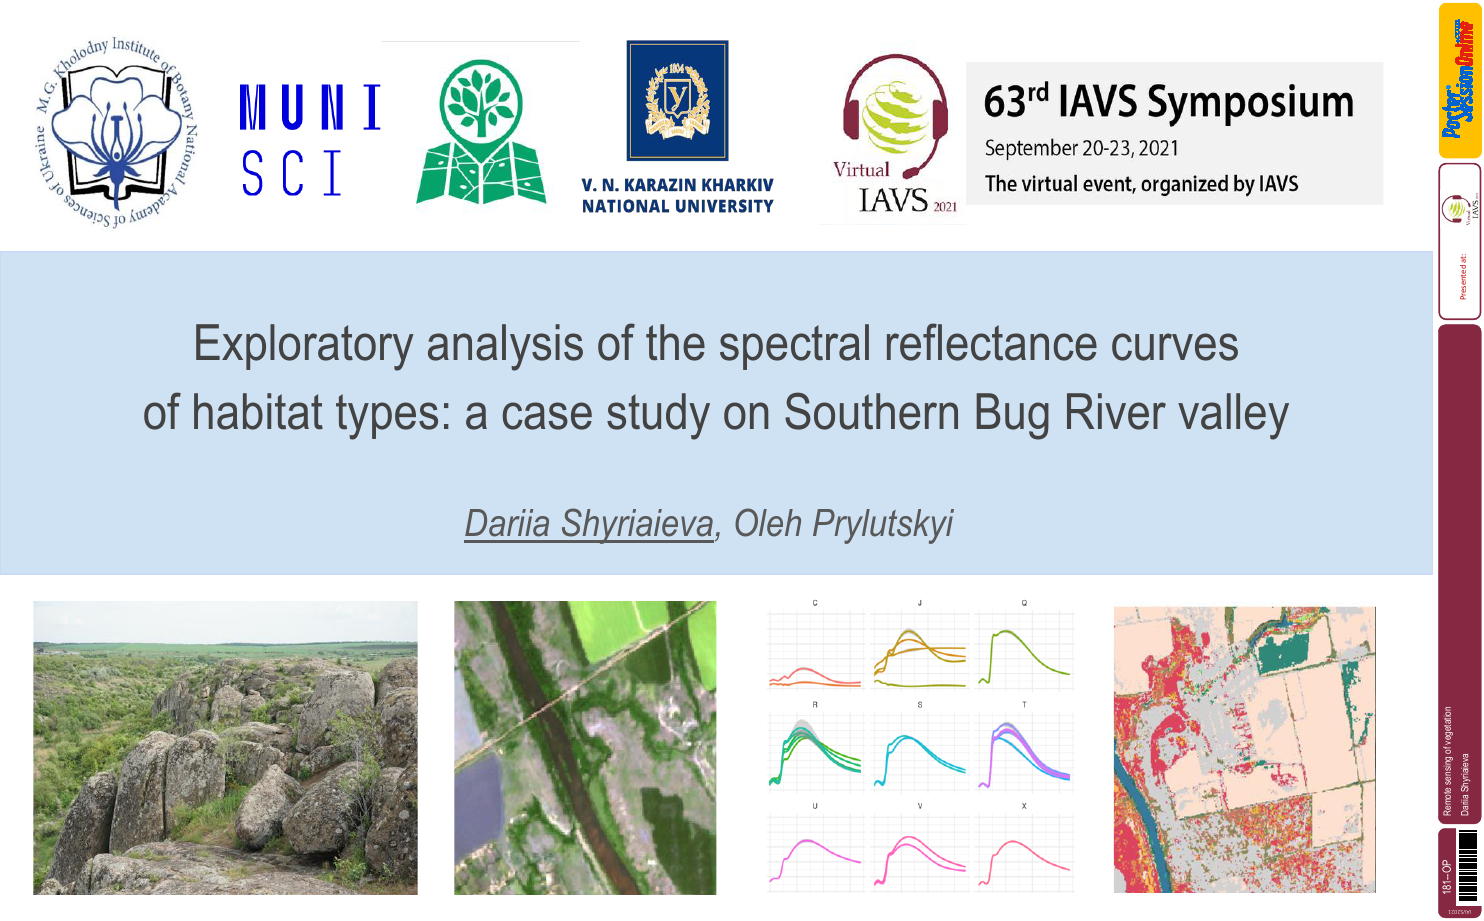
Title: Exploratory analysis of the spectral reflectance curves of habitat types: a case study on Southern Bug River valley, Ukraine
Authors: Dariia Shyriaieva , Oleh Prylutskyi
Centre:
|
|
You must be registered to reply or comment.
|
|
EXPLORATORY ANALYSIS OF THE SPECTRAL REFLECTANCE CURVES OF HABITAT TYPES: A CASE STUDY ON SOUTHERN BUG RIVER VALLEY, UKRAINE
|
 | | Dariia Shyriaieva |
Thread initiator
Reg: 9/8/2021 5:49:00 PM
|
|
Comment# 1
|
I invite colleagues to open debate around the issues raised in my presentation, both those relating to research and to practice.
Comment added on 9/14/2021 10:25:00 AM
|
|
|
|
| |
|
|
| | Dariia Shyriaieva |
Thread initiator
Reg: 9/8/2021 5:49:00 PM
|
|
Comment# 2
|
Sorry, there was an issue of uploading self-recorded presentations, and my video was not avaliable. Now it is already here, so I will be glad to see your comments and questions!
Comment added on 9/20/2021 2:36:00 PM
|
|
|
|
| |
|
|
| | Susan Wiser |
Subspeciality
Reg: 9/1/2021 10:47:00 AM
|
|
Comment# 3
|
Thank you very much Dariia for your very interesting presentation. I am currently working on separating vegetation types using Sentinel data and I found the way you showed the refelectance differences (such as Slide 15) between the different habitats and then how this varied seasonally very revealing (rather than just being a black box). It wasn't that clear to me how you then generated the curves in Slide 16 -- are these just smoothed versions of the figure in Slide 16?
Have you published this approach anywhere? I would be interested in displaying similar graphs to your Slide 15 in my own work, but don't want to do this unless I have a way of citing your work, since it is your idea.
If you look at my presentation (number 39) you will see what I am trying to do. I would be very interested in your feedback, especially as incorporating remote sensing data into this kind of work is new for me.
Best wishes,
Susan
Comment added on 9/22/2021 6:41:00 AM
|
|
|
|
| |
|
|
| | Dariia Shyriaieva |
Thread initiator
Reg: 9/8/2021 5:49:00 PM
|
|
Comment# 4
|
Dear Susan,
Thank you for your feedback and attention to our work! Our approach has not been published yet, but we are working on it. We expected some feeedback from colleagues from the IAVS Symposium in order to understand in which direction to move further - and finish preparing the manuscript accordingly. So your comment and the fact that you would like to use this tool are really important for us. Also, we plan to correct slightly the visualization details (for example, mean+- sd showed more understandable insight than min-max variation of reflectance values).
As for the spectral curves, they were obtained by simple smoothing the reflectance values of different satellite bands with geom_smooth() function of ggplot2 R package (which uses GAM regression). Before that we obtained mean wavelength values for each Sentinel band via Google Earth Engine documentation (https://docs.sentinel-hub.com/api/latest/data/sentinel-2-l2a/).
Also, thank you for inviting to learn more about your research! Hopefully, after the end of the symposium this forum will be active, I plan to spend more time watching presentations over the next weekend.
Dariia
P.S. I have additional comment from my co-author Oleh:
###
Thank you a lot, for your interest in our research. In addition, I can share you that literally couple of days ago we have achieved a significant progress in image classification of our study area and obtained a high-quality habitat map using both random forest and neural network approaches. We used multi-season time series of optical bands, which showed significantly better results than single satellite imagery (irrespective of whether it was original imagery or single—season medianized one, like in our IAVS-presentation was).
As I learned from your presentation, SWIR1 and SWIR2 were the most important satellite variables in your case. That is highly accordant with our ML results, our most important variable are B11 & B12 as well (during all seasons). In some seasons some other bands (B8A, B7, B5, B2) came to the fore, but only SWIRs were annually important (for RF at least).
We are grateful again for your interest and open for any collaboration, i.e. testing our approach in different areas and datasets, as well as further development of semi-automated habitat and vegetation mapping technics. Feel free to adopt our code example (https://github.com/olehprylutskyi/habitat-spectral-reflectance) for your purposes or discuss any other points we share interest in via e-mail prylutskyi@karazin.ua and darshyr@gmail.com
All the best,
Oleh
Comment added on 9/23/2021 12:52:00 PM
|
|
|
|
| |
|
|
| | Susan Wiser |
Subspeciality
Reg: 9/1/2021 10:47:00 AM
|
|
Comment# 5
|
Thanks so much for your detailed answers Dariia and Oleh. We have a project underway (similar to the one in my presentation) and it might be worthwhile to collaborate with you to test your approach. We also are planning on using a national dataset to distinguish forest types more broadly and it could be a very worthwhile approach for that project. I will be in touch as these ideas develop.
Best wishes,
Susan
Comment added on 9/27/2021 11:59:00 PM
|
|
|
|
| |
|
|
|
|
|
|
| You must be registered to reply or comment. |
|
|
|
|
|
|
| Most viewed poster for this congress |
|
|
Poster: 122
Visits: 528
Title: Growth response of plantation species (Cedrela odorata and Terminalia superba) to variability in site and climatic conditions
Authors: David Akowuah , Reginald T. GuurohMark Appiah2
Centre:
|
|
|
|
|
|
|
| Poster most viewed in this topic |
|
|
Poster: 54
Visits: 134
Title: Linking spectral heterogeneity and plant diversity across scales and time: a Czech Republic experience
Authors: Michela Perrone , Mirko Di Febbraro, Jan Divíek, Milan Chytr, Maria Laura Carranza, Duccio Rocchini, Marco Malavasi
Centre:
|
|
|
|